Turn Your Financial Data Into Smart Decisions

Automated reports. Real-time clarity. Smarter finance decisions

💡AI Financial Reporting
🔄Integration and Automation

Effortlessly connect and sync your data from QuickBooks, Google Sheets, Xero, and CSV files to unlock interactive, visually rich, and real-time reports.
Save hours of manual work with smart automation and streamlined reporting

Each dashboard and report delivers detailed, intelligent analysis. No Manual digging required. It is fully automated and ready to impress.

📈Virtual CFO Insights

Empower business leaders with timely, relevant insights to respond faster and smarter.
Automate routine analysis, streamline reporting, and share dashboards that drive strategic, data-backed decisions — all with a focus on growth.

Transforming Data into Insights

At SolveArc Reporting, we automate report creation, providing real-time insights and visuals to enhance decision-making for your business with our AI-powered virtual CFO.

A computer screen displaying a data analytics dashboard with graphs and charts. A blue line graph shows fluctuations in data over time, and a section highlights the number of page views. A pie chart is partially visible, indicating a breakdown of different data elements.

150+

15

Trusted by Experts

Proven Success

Automated Reporting Solutions

Transform data into insights with seamless automation and real-time reporting for your business.

A person is holding a smartphone displaying an analytics or insights screen with various metrics and numbers. The individual is wearing a casual white shirt and a watch with a black band. The surrounding environment includes an indoor plant.
AI-Powered CFO

Get valuable insights to guide your decision-making with our intelligent reporting solution.
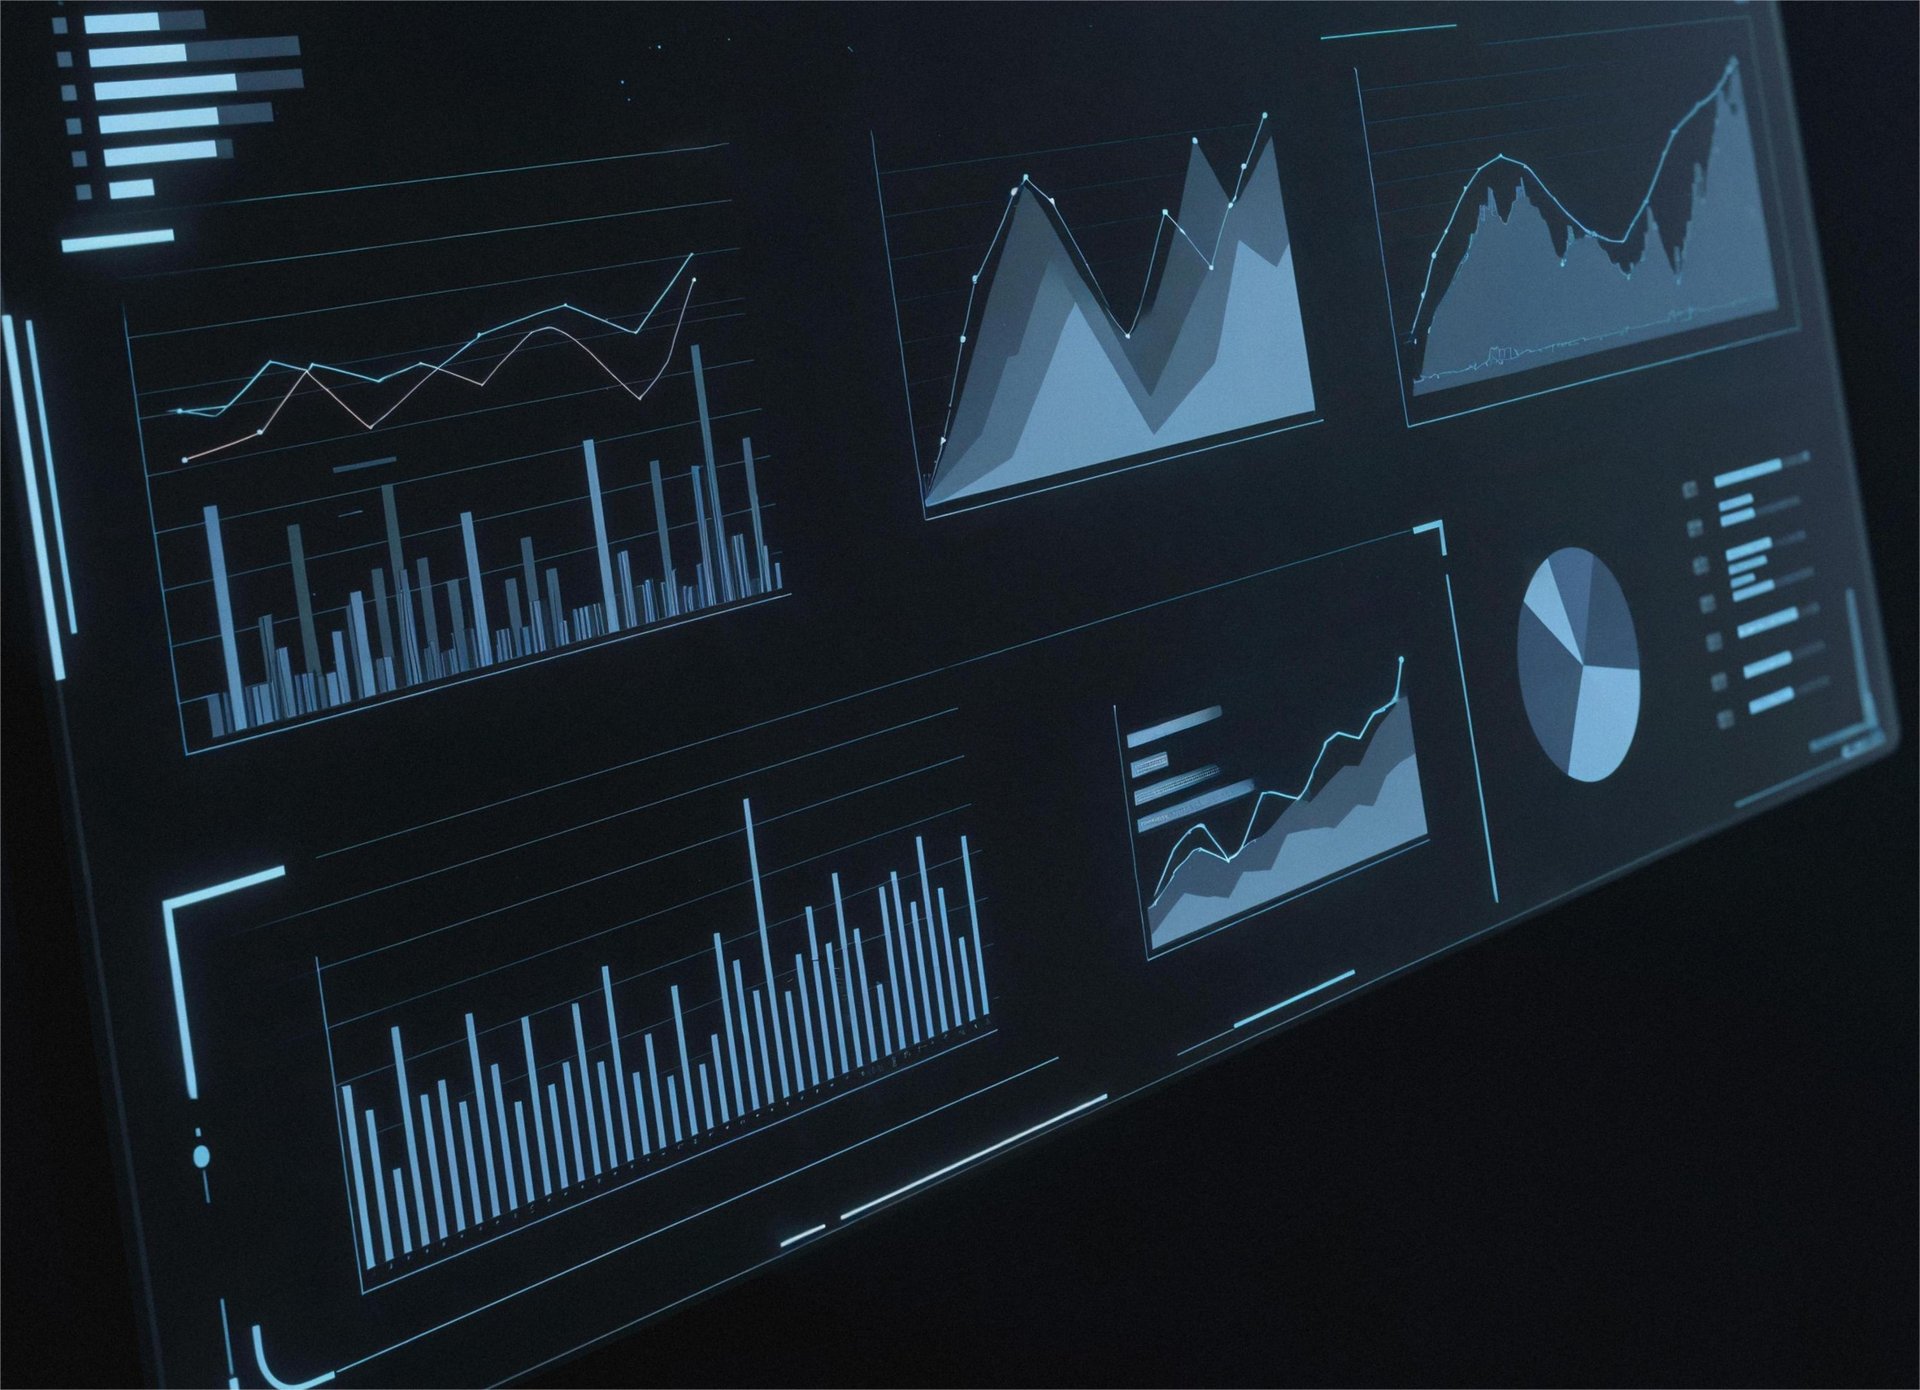
Visual Dashboard

Experience an engaging dashboard that updates continuously with your business metrics in real-time.

Streamlined Processes

Eliminate tedious manual tasks and focus on strategic decision-making with our automated solutions.

Solvearc Reporting transformed our reporting process, saving us time and providing valuable insights effortlessly.

John Doe

A computer screen displaying analytics dashboards with various charts, including a line graph on the left and a cohort analysis table on the right. The table is populated with different shades of blue, indicating varying levels of user activity over several weeks. Text labels and numbers detail user retention statistics.
A digital dashboard displays metrics related to web performance. Graphs show detailed statistics such as total clicks, total impressions, average click-through rate (CTR), and average position over time. The chart utilizes various colors to distinguish different data sets, and the interface features tabs labeled 'QUERIES', 'PAGES', 'COUNTRIES', 'DEVICES', and 'SEARCH APPEARANCE'.

★★★★★

Get in Touch

A laptop with an open screen displaying dashboard analytics featuring charts, graphs, and numerical data related to sales and subscriptions. The interface is predominantly dark-themed with sections highlighting key performance metrics. The device shown is a MacBook Pro, indicated by the keyboard layout and branding.

Contact us to transform your data into actionable insights and streamline your reporting process today.